Physical Address
304 North Cardinal St.
Dorchester Center, MA 02124
Physical Address
304 North Cardinal St.
Dorchester Center, MA 02124
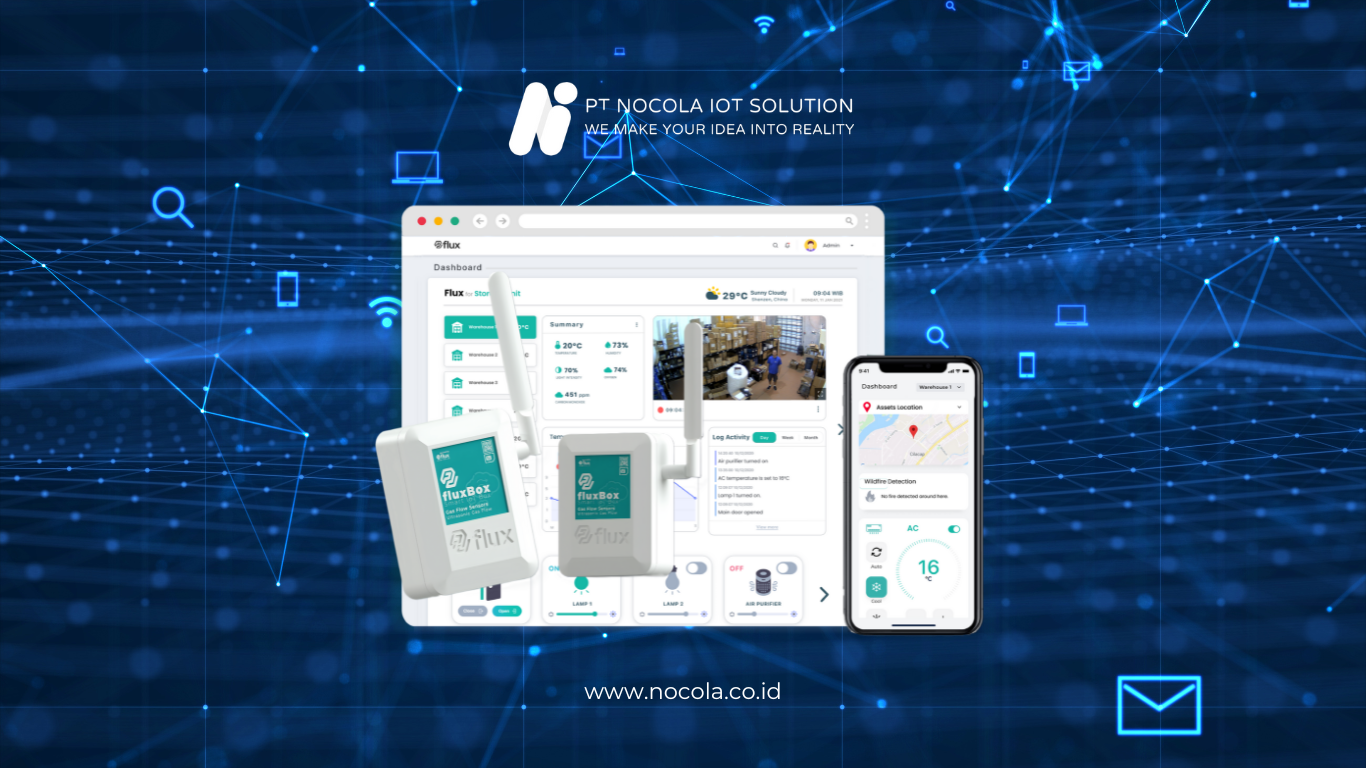
The development of Internet of Things (IoT) has transformed how industries, businesses, and governments manage data. Every sensor, device, and automation system can now generate large amounts of real-time data. However, abundant data without processing holds little significant value.
This is why IoT data visualization has become a primary necessity. Through the Flux Dashboard, complex data can be presented in a simpler, more understandable, and actionable format. This article will thoroughly discuss how the Flux Dashboard supports digital transformation, its benefits, standout features, and real-world implementations across various sectors.
Read More: Nocola: Example of IoT Application in Oil and Gas
In the IoT ecosystem, data comes from various sources such as temperature, humidity, pressure sensors, GPS, and energy consumption. Without visualization, data consists merely of numbers that are difficult to interpret.
IoT data visualization helps:
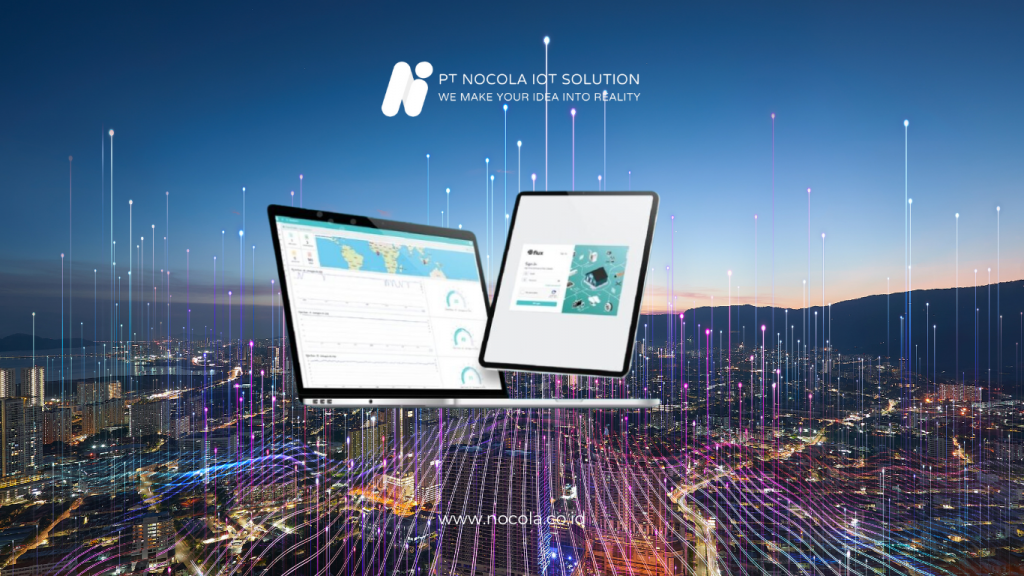
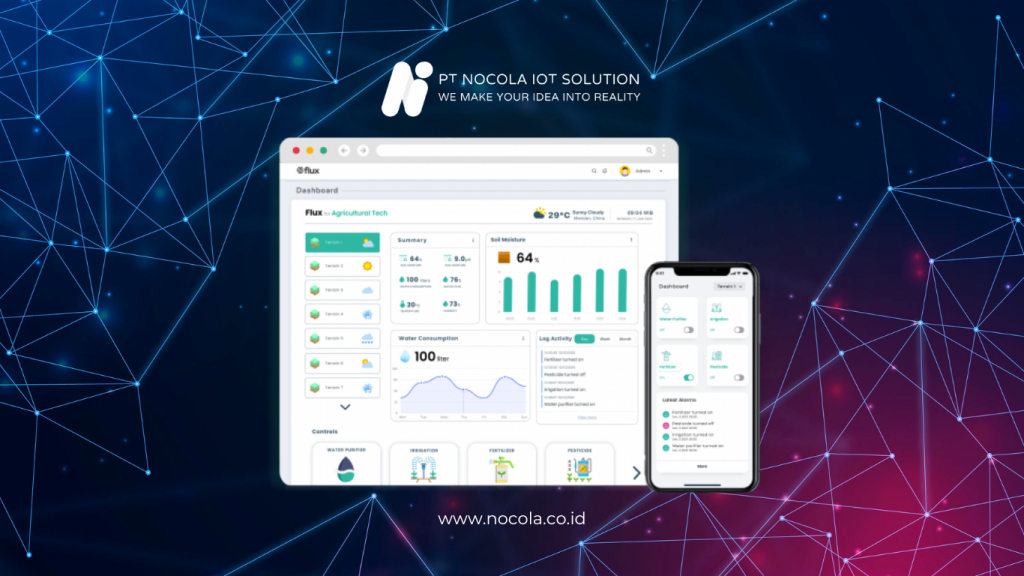
The Flux Dashboard is a part of the Flux IoT Solution ecosystem designed to display IoT data in an interactive visual format. Data gathered from IoT devices is no longer presented as complex tables but instead as charts, graphs, indicators, and real-time maps.
With the Flux Dashboard, users can:
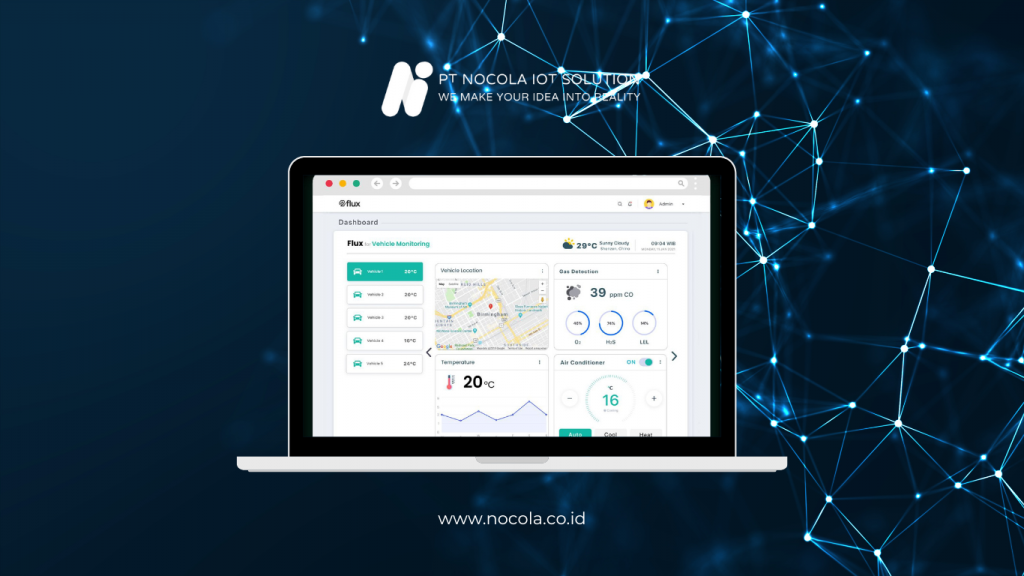
The Flux Dashboard is designed to meet the needs of modern industries with standout features, including:
All data is displayed live, enabling users to respond quickly to emergency conditions.
Each user can customize the dashboard’s appearance according to their needs, from design, charts, to data indicators.
The Flux Dashboard supports data integration from various IoT devices, centralizing all information within one platform.
If an anomaly is detected, the system can send automatic alerts via email, SMS, or mobile applications.
In addition to visualization, the Flux Dashboard provides historical data analysis features and periodic reports for management needs.
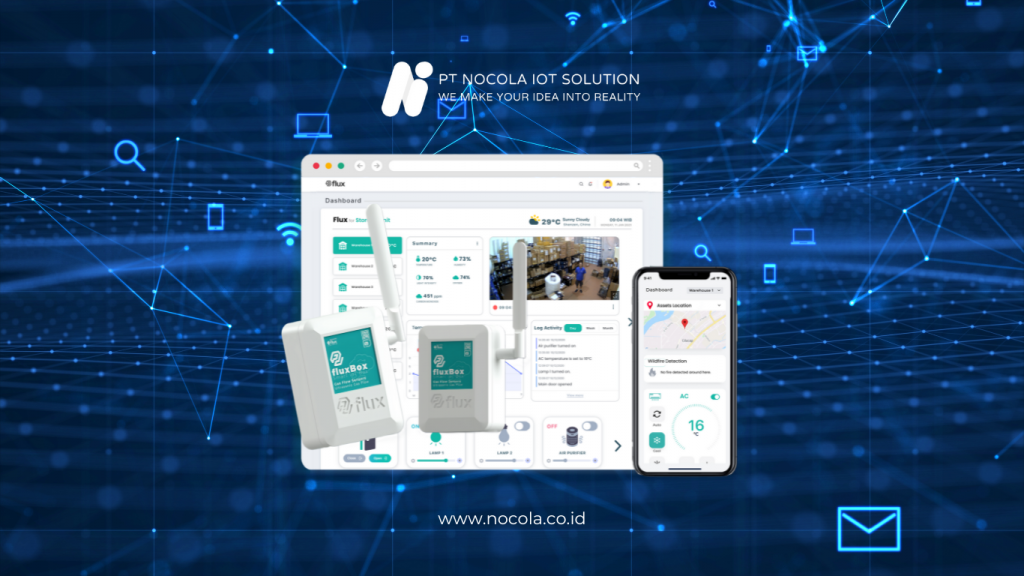
The implementation of the Flux Dashboard has a significant impact on various sectors.
Why is Flux Dashboard the right choice?
The Flux Dashboard presents an intelligent solution for easy, effective, and real-time IoT data visualization. With features like live monitoring, device integration, customizable dashboards, and automated notifications, Flux Dashboard assists industries in improving efficiency, reducing risks, and accelerating decision-making.
In an increasingly data-driven world, Flux Dashboard is a crucial investment for the future of the digital industry.