Physical Address
304 North Cardinal St.
Dorchester Center, MA 02124
Physical Address
304 North Cardinal St.
Dorchester Center, MA 02124

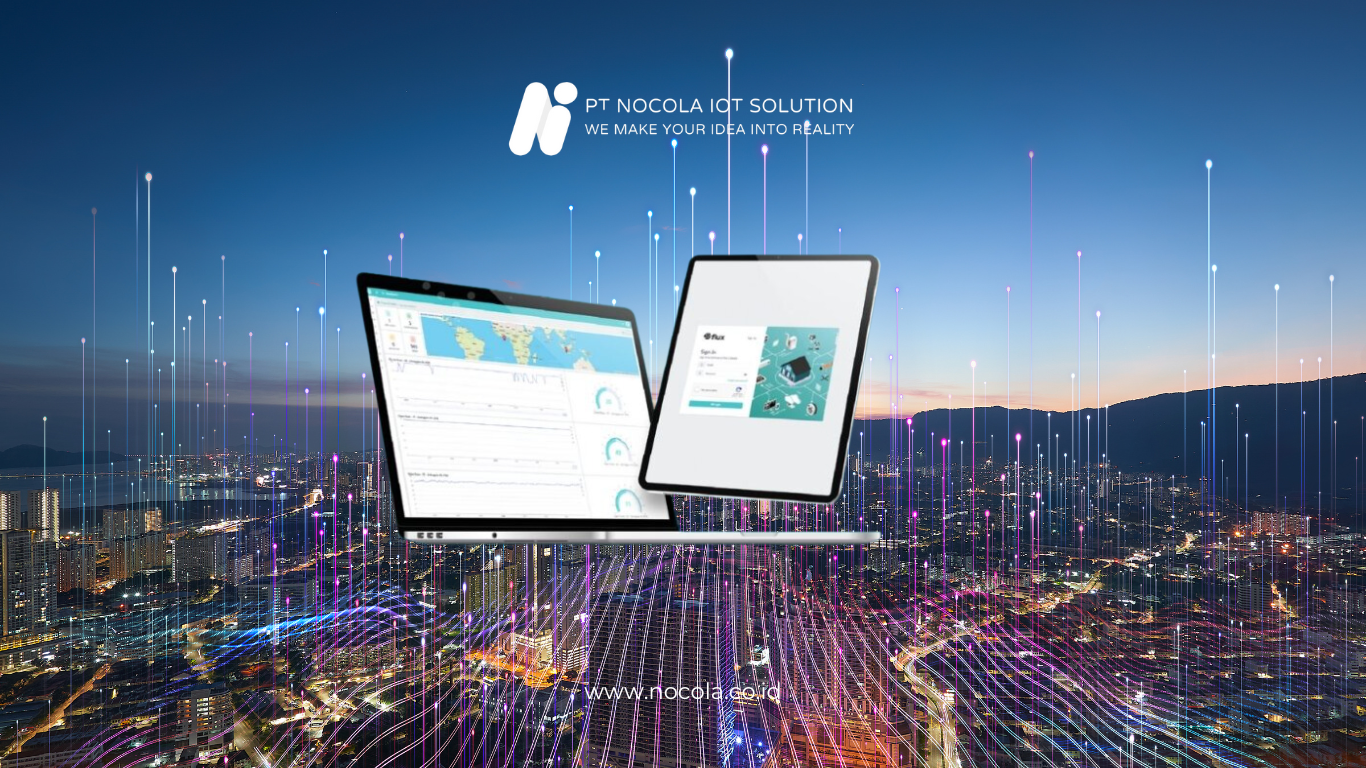
In the era of Industry 4.0, connectivity and automation have become vital elements in the manufacturing world. One of the key supporting technologies is the IoT (Internet of Things), which allows various devices in factories to connect and transmit data in real-time. However, the data collected from these sensors will be of little use without appropriate visualization systems — this is where the role of the IoT Dashboard becomes crucial.
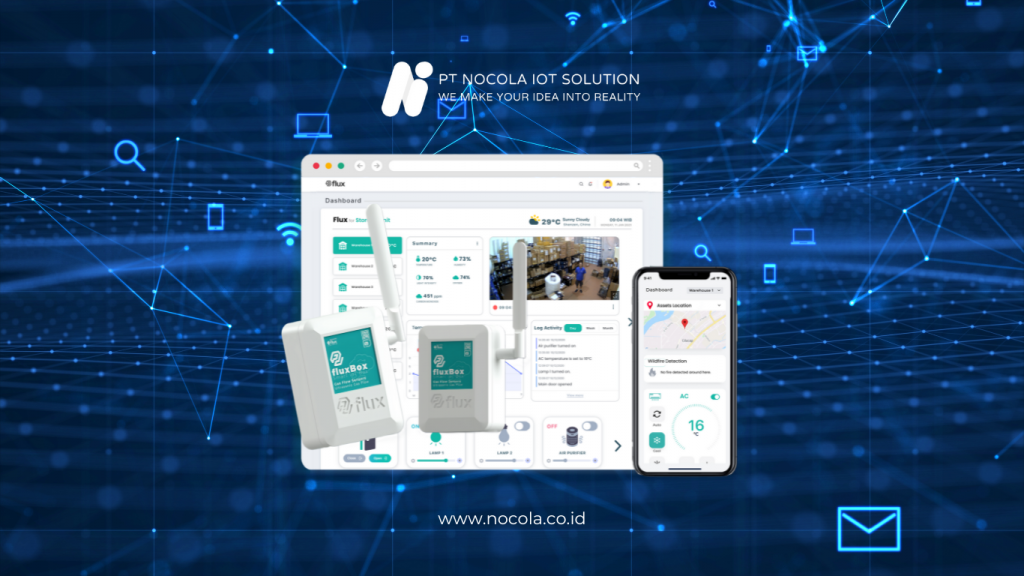
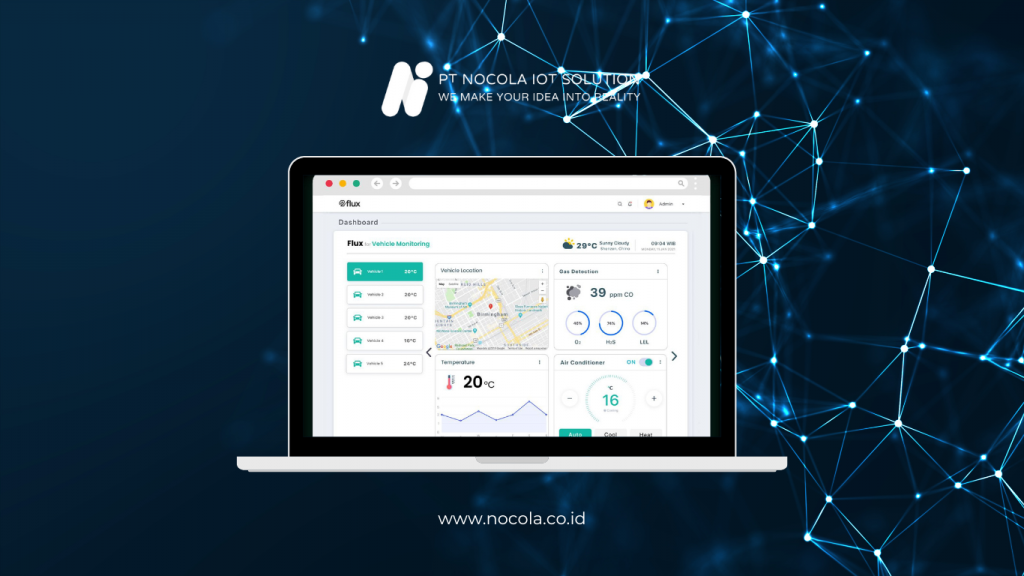
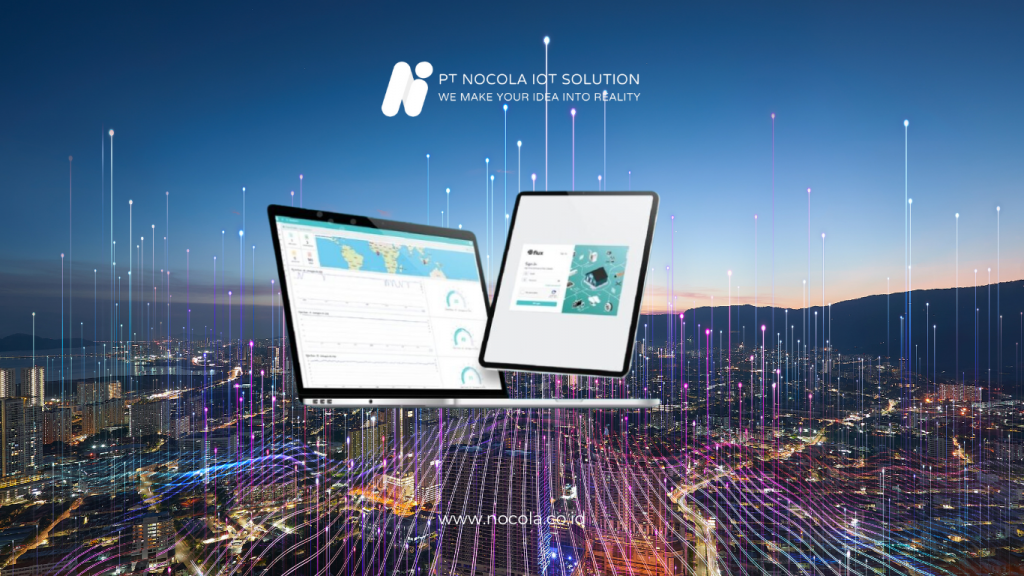
The IoT Dashboard is a web-based graphical display that shows information from sensors or devices connected to the internet. This dashboard presents production data, machine performance, energy levels, temperature, humidity, and various other important metrics in visual forms such as graphs, tables, or color indicators.
A well-designed dashboard not only helps operational teams see current conditions but also facilitates data-driven decision-making. Thus, factories can reduce downtime, increase productivity, and save on operational costs.
Read Also: Internet-of-Things-IoT-Explained-Riseup-Labs
Before building an IoT dashboard, you need to know the main objectives of the monitoring you wish to conduct. Are you looking to:
Having clear objectives will determine what parameters need to be monitored, what types of sensors must be used, and which metrics will be displayed on the dashboard. For example, if you want to monitor temperature and vibration of machines to prevent damage, then you will need temperature sensors and accelerometers.
This stage includes selecting the following:
Utilize industrial sensors that are compatible with your system, such as:
All sensors will be connected to an IoT gateway responsible for transmitting data to the cloud or local server using protocols such as MQTT, HTTP, or CoAP.
The type of network can be adjusted based on needs:
Don’t forget to consider network security, including the use of SSL encryption and two-factor authentication.
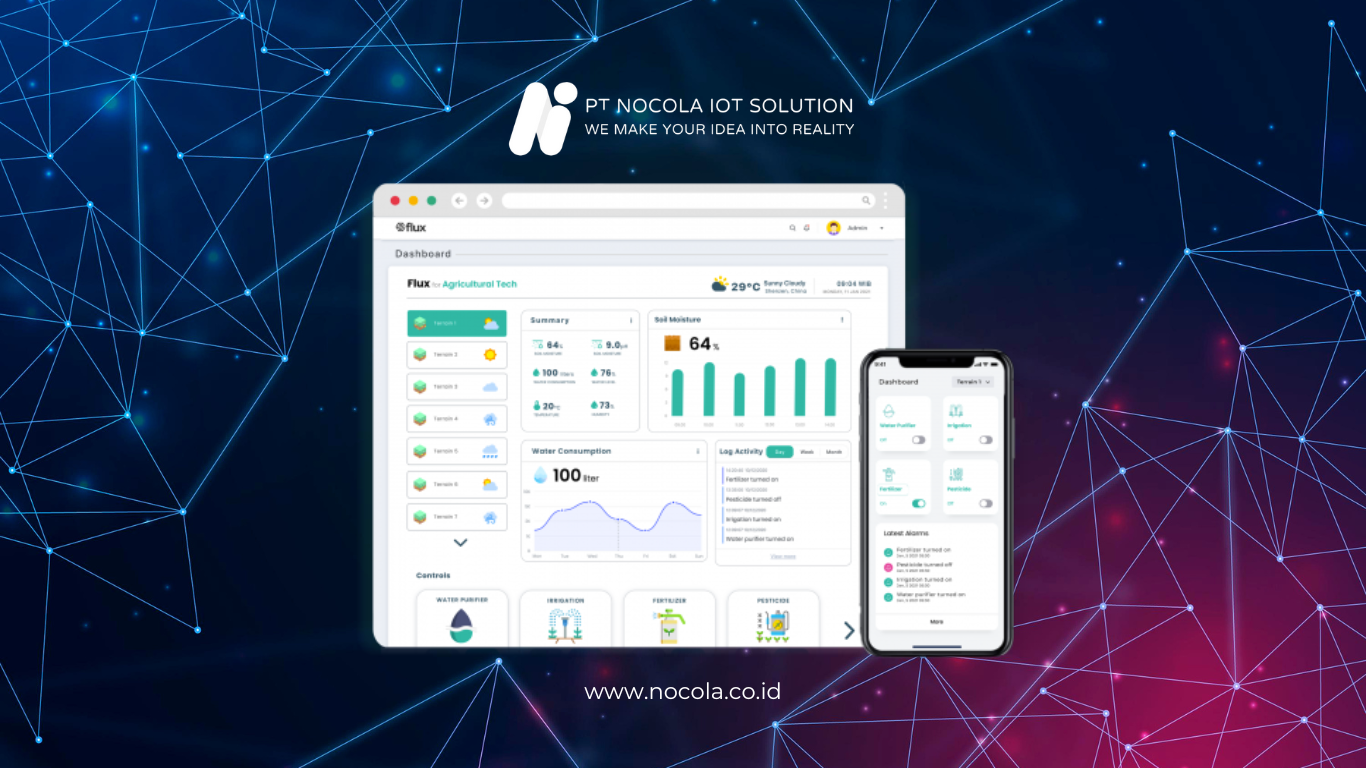
A good dashboard is one that is easy to read, relevant, and responsive. Some design principles for IoT production dashboards include:
The dashboard should be accessible via:
Data can be stored locally using an internal server or in the cloud using platforms such as:
The cloud offers higher flexibility and scalability, while local servers are more suitable for high data security.
Use time-series databases like InfluxDB or TimescaleDB to store continuously changing sensor data.
Provide a RESTful API for communication between backend systems and the frontend dashboard. This API can be used for:
Building an IoT dashboard for factory production monitoring is not just about displaying data, but creating a system that helps operations become smarter, more efficient, and responsive. From selecting sensors, networks, and backends to designing the right visual displays, every element must be thought through integratively.
With an informative and real-time dashboard, factories can directly address Industry 4.0 challenges and enhance their competitiveness in the market. Therefore, it is no surprise that implementing an IoT dashboard is now a priority in the digital transformation roadmap in the manufacturing sector.