Physical Address
304 North Cardinal St.
Dorchester Center, MA 02124
Physical Address
304 North Cardinal St.
Dorchester Center, MA 02124
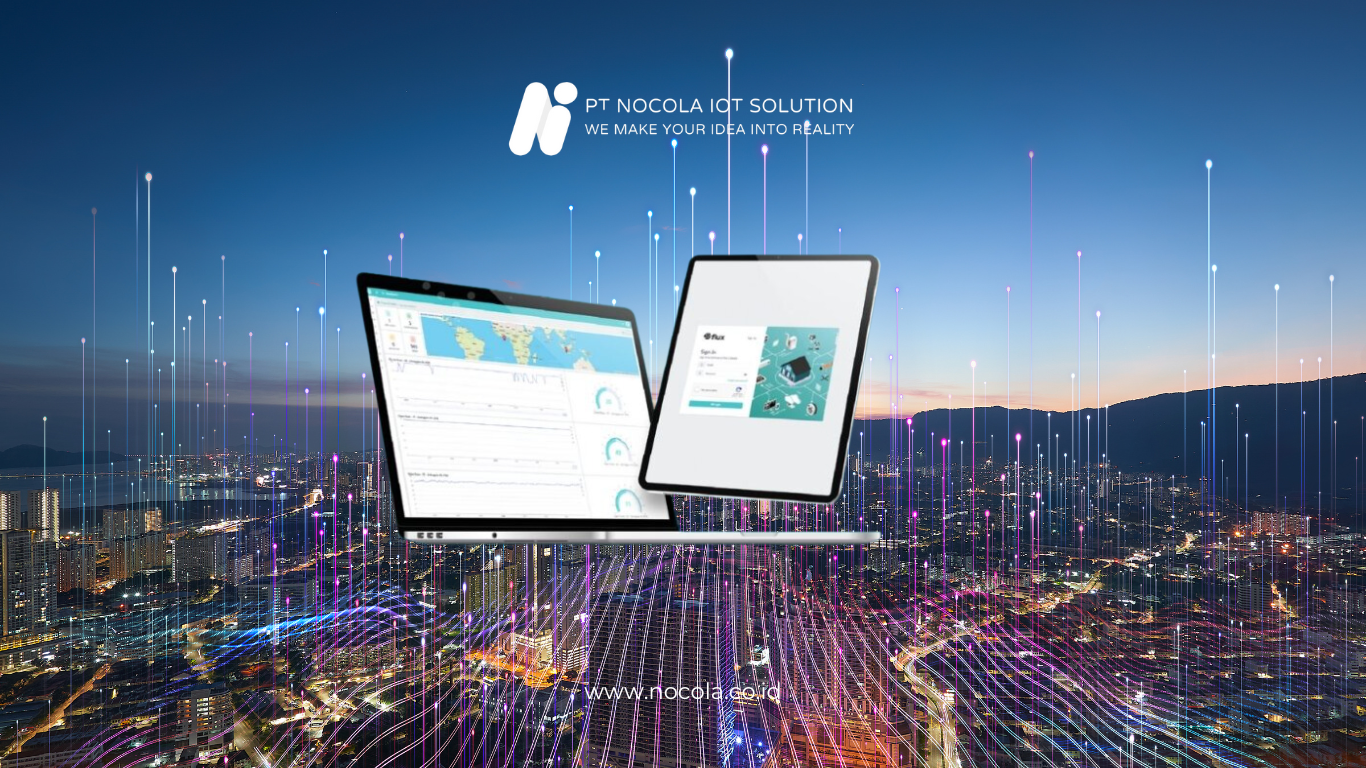
In the era of digital transformation, companies are no longer short of data. Instead, the biggest challenge today is how to manage and utilize data from multiple sources so that it truly supports operations and decision-making. In many organizations, sensor data, field activity data, machine data, and environmental data are often scattered across separate, stand-alone systems.
This situation forces operational teams to open multiple applications, combine manual reports, and perform separate data consolidation. As a result, the monitoring process becomes inefficient and prone to miscommunication between teams.
Flux is introduced as an integrated monitoring solution that brings together multiple data sources into a single unified dashboard. With one interface, companies can monitor field conditions, asset performance, and IoT sensor data in real time in a structured and centralized way.
This article explains in detail how Flux enables a single dashboard for multiple data sources while improving the effectiveness of operational monitoring.
As technology continues to evolve, companies now rely on a wide range of digital devices and systems in their operations, including on-site IoT sensors, machine monitoring systems, activity logging systems, and facility management platforms. Each of these systems usually comes with its own dashboard.
Problems arise when data that should be interconnected is instead isolated. Production teams monitor machine performance in one application, environmental teams track water or air quality in another, while management receives reports in separate formats. This makes comprehensive analysis more difficult.
Beyond data fragmentation, another challenge lies in differences in data formats and standards. Not all systems use the same data structure, making integration more complex and requiring additional technical effort.
In such conditions, companies often experience delays in identifying issues. Critical information that should be immediately visible is hidden behind multiple, disconnected dashboards.
Flux is designed to address these challenges through an integrated IoT platform approach. All data from various devices, sensors, and systems can be collected, managed, and presented in a single, consistent dashboard.
With this approach, companies no longer have to rely on multiple separate monitoring systems. All essential information is available within one unified ecosystem.
Flux is an integrated IoT platform developed to help organizations connect, monitor, and manage various devices and operational data within a single system.
As a platform, Flux does not function merely as a dashboard. It also acts as a connector between IoT devices, sensors, gateways, and enterprise-level application systems. Flux enables automated, secure, and continuous data collection.
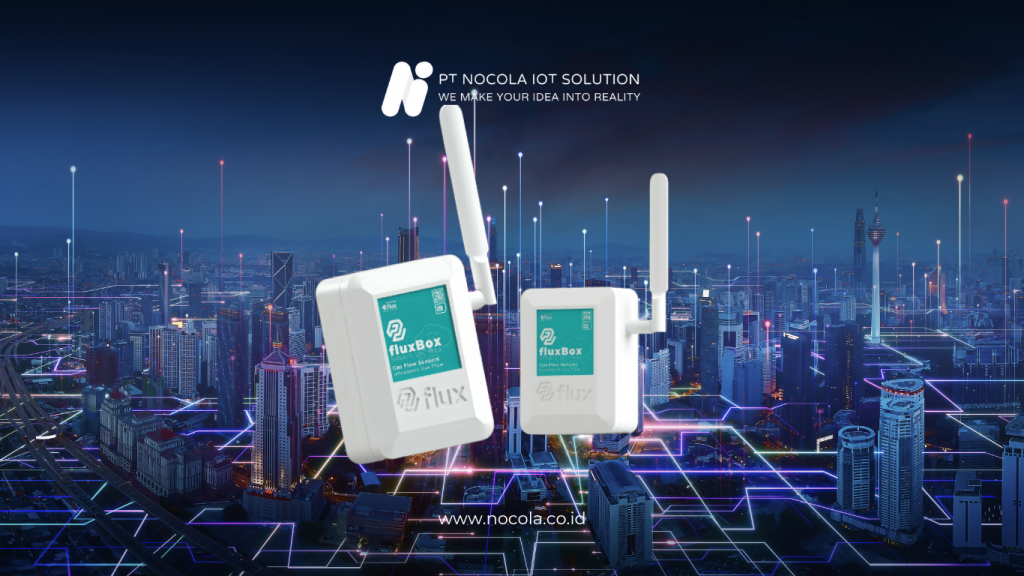
Within the Flux ecosystem, components such as Fluxbox, Fluxgateway, and Fluxdashboard work together in an integrated manner to ensure that field data can be transmitted, processed, and visualized effectively. The system is designed to be flexible and suitable for a wide range of use cases, from environmental monitoring and industrial operations to utilities and smart facilities.
Flux supports the integration of various types of sensors and communication protocols. This allows companies to connect both legacy devices and new equipment without making major changes to their existing infrastructure.
In addition, Flux provides device management features, connection status monitoring, and historical data management. The collected data is used not only for real-time monitoring, but also for long-term analysis.
With this approach, Flux becomes a critical foundation for companies seeking to build a centralized monitoring system that can be further expanded for advanced needs such as analytics and automation.
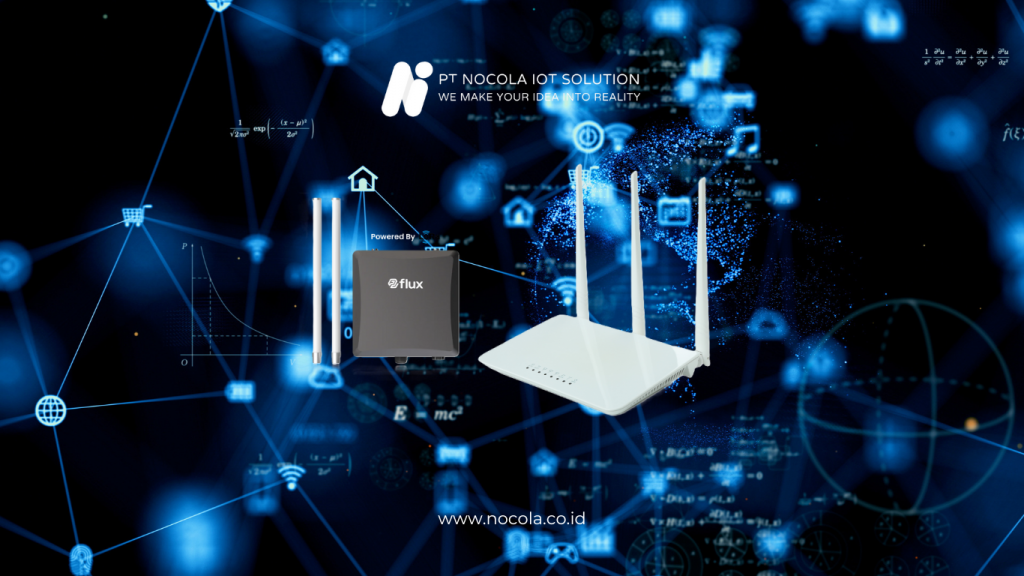
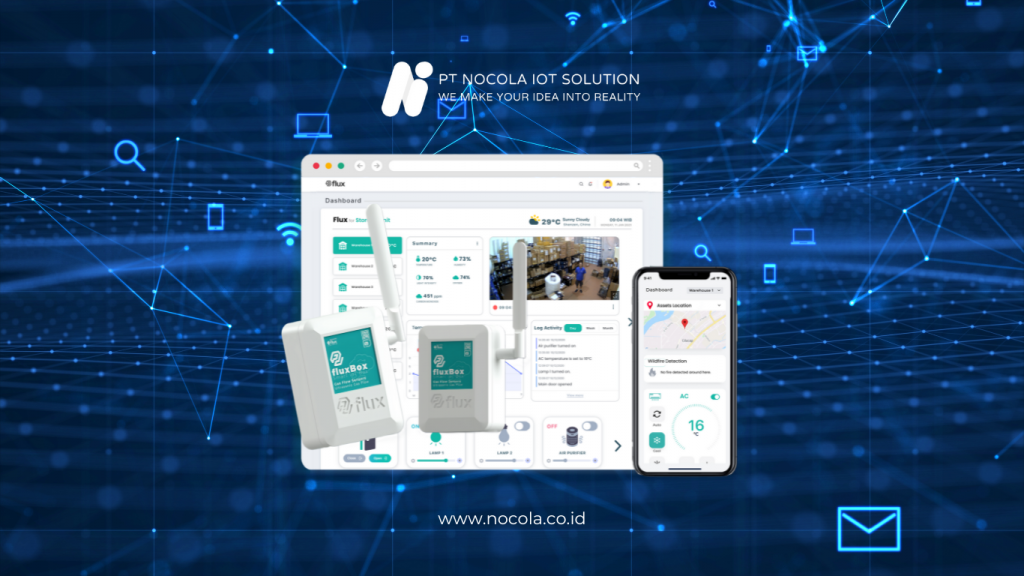
The main strength of Flux lies in its ability to unify multiple data sources into a single, easy-to-use dashboard. Sensor data, machine data, environmental data, and operational data can all be displayed within one integrated interface.
Users can configure dashboard views according to their needs. Each team can have its own monitoring panels while still working within the same system. As a result, all divisions rely on a single, consistent data source.
Flux supports data visualization in various formats, such as trend charts, tables, status indicators, and device location maps. Key information can be presented in a concise and clear way, enabling quick and effective monitoring.
In addition to real-time data, Flux also provides access to historical data. Users can explore past records to identify patterns, trends, and changes over specific periods. This capability is highly valuable for performance analysis and operational evaluation.
With a single dashboard, companies can monitor multiple locations at once, including factories, buildings, project sites, and remote areas. All data is presented through one centralized system.
The concept of one dashboard for multiple data sources also simplifies coordination between teams. Technical teams, operational teams, and management can access the same real-time information, reducing the risk of miscommunication and accelerating decision-making.
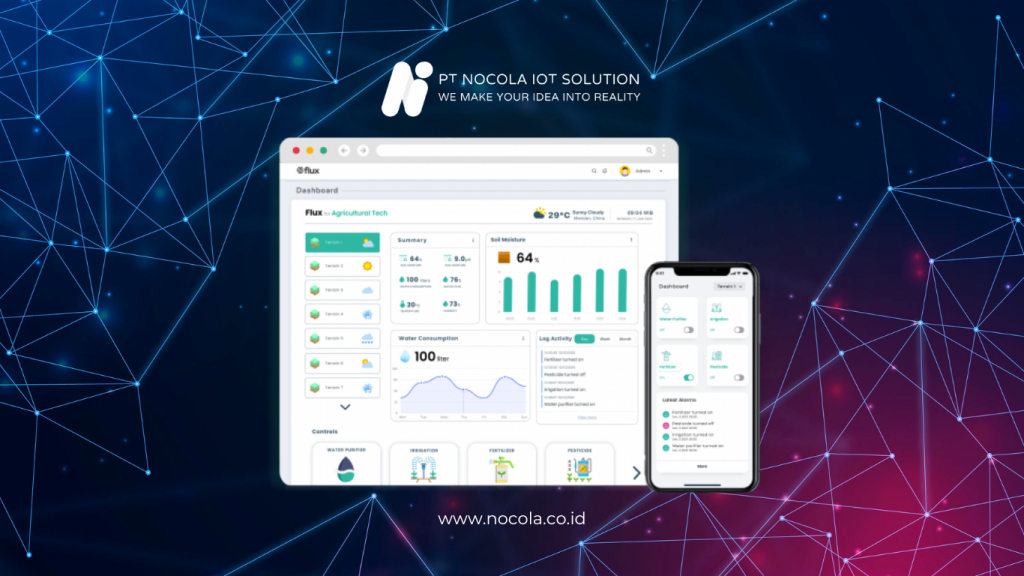
Implementing Flux as an integrated monitoring dashboard delivers tangible improvements in operational efficiency.
The first benefit is improved visibility. With a single dashboard, management can gain a comprehensive view of operational conditions without switching between multiple systems. Critical information can be accessed anytime and anywhere.
Another key benefit is faster response to incidents. Flux can be configured to send notifications when abnormal conditions occur, such as sensor values exceeding thresholds or devices losing connectivity. Teams can take immediate action before issues escalate.
Flux also helps improve data accuracy and consistency. Since all data is collected directly from connected devices and systems, the risk of errors caused by manual recording is significantly reduced.
Furthermore, Flux supports cross-team collaboration. The same data can be utilized by different departments, including operations, maintenance, environmental management, and executive management.
Over time, the data collected through Flux can be leveraged for more advanced analysis. Companies can adopt data-driven approaches for maintenance planning, energy optimization, and asset performance improvement.
With an integrated monitoring system in place, organizations not only observe current conditions, but also build a solid foundation for intelligent systems in the future.
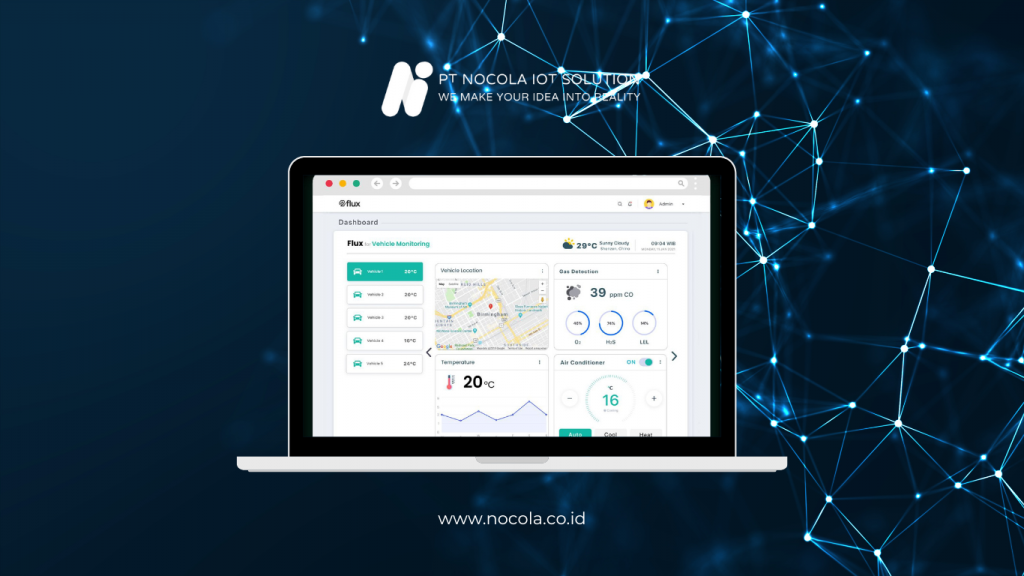
To deliver maximum value, Flux is designed to be easily integrated with the operational systems already in use within the organization. Data collected by Flux can be connected to management systems, reporting platforms, and other operational applications.
This integration enables companies to build more efficient digital workflows. For example, equipment condition data from Flux can be linked to maintenance systems to support condition-based maintenance scheduling.
Flux can also be integrated with other digital solutions within the Nocola ecosystem, such as environmental monitoring systems and field activity and inspection logging systems. This approach helps organizations connect technical sensor data with human activities in the field.
With proper integration, companies can establish a centralized data source that covers field conditions, operational activities, and inspection results. This is essential for audits, reporting, and performance evaluations.
In addition, integrating Flux with business systems enables management to link technical data with operational performance indicators. Sensor data no longer stands alone, but becomes an integral part of strategic decision-making processes.
This integrated approach strengthens Flux’s role as a monitoring platform that focuses not only on data visualization, but also on comprehensive business process support.
As the volume and variety of operational data continue to grow, companies require a monitoring solution that can unify all critical information within a single integrated system. Fragmented dashboards and disconnected monitoring tools only slow down decision-making processes.
Flux serves as a single dashboard for multiple data sources. Through its integrated monitoring platform, Flux enables organizations to connect various devices, sensors, and systems into one ecosystem that is easy to access and manage.
With Flux, companies gain broader operational visibility, faster response to incidents, and more accurate and consistent data. In addition, integration with operational systems and other digital solutions allows organizations to build more efficient and data-driven workflows.
For organizations aiming to accelerate digital transformation and improve monitoring quality, adopting a single integrated dashboard powered by Flux is a strategic step toward building more adaptive, transparent, and future-ready operations.
