The modern world faces increasingly complex environmental challenges. Air pollution is on the rise, water quality is declining, and industrial emissions continue to be a global concern. However, amid these worries, technology offers a glimmer of hope. Through the integration of monitoring systems like Water Quality Monitoring System (WQMS), Air Quality Monitoring System (AQMS), and Continuous Emission Monitoring System (CEMS), an intelligent ecosystem is now available that can protect the Earth through the power of data.
These three systems are not just ordinary monitoring tools. They operate in real-time, are integrated, and provide accurate data to governments, industries, and the public. This article will discuss how WQMS, AQMS, and CEMS form an intelligent ecosystem that comprehensively helps protect the environment—from water quality, air quality, to industrial emissions.
Environmental issues are no longer local or sporadic. Pollution can occur anytime and have widespread effects. To respond effectively, real-time data is needed so that:
Pollution events can be detected faster.
Corrective actions can be taken immediately.
Governments can establish regulations based on evidence.
1.2 Data is the Foundation of Modern Environmental Policies
All developed countries use monitoring data as a guideline for:
Industrial emission limits
Daily Air Quality Index (AQI)
Clean water quality standards
Public health risk analysis
Indonesia is also moving in this direction.
1.3 Without Data, Pollution Management is Just Guessing
Inaccurate data will result in misguided policies. With automated monitoring, all decisions are based on facts, not assumptions.
2. WQMS: The Frontline of Water Quality Monitoring
2.1 What is WQMS?
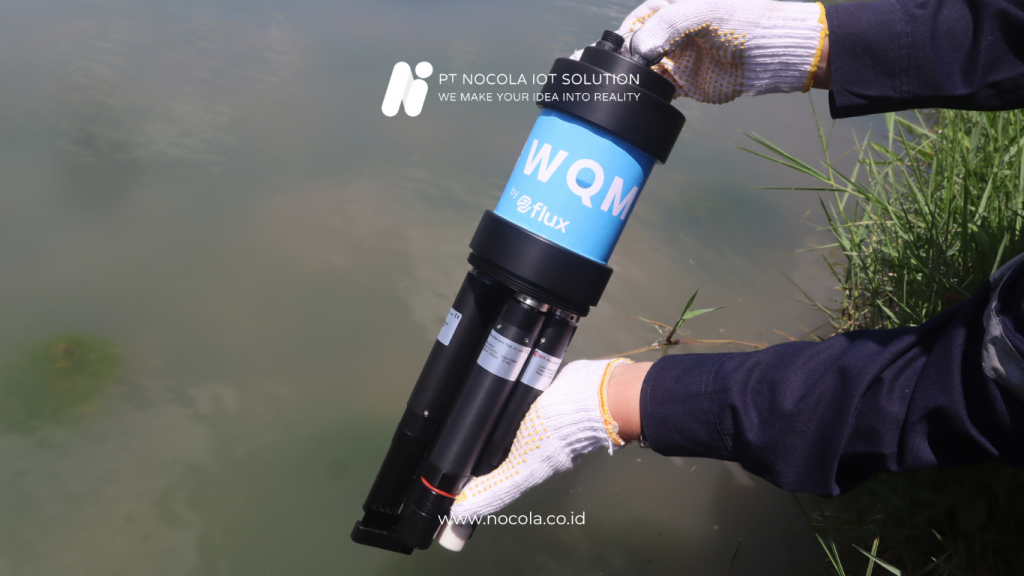
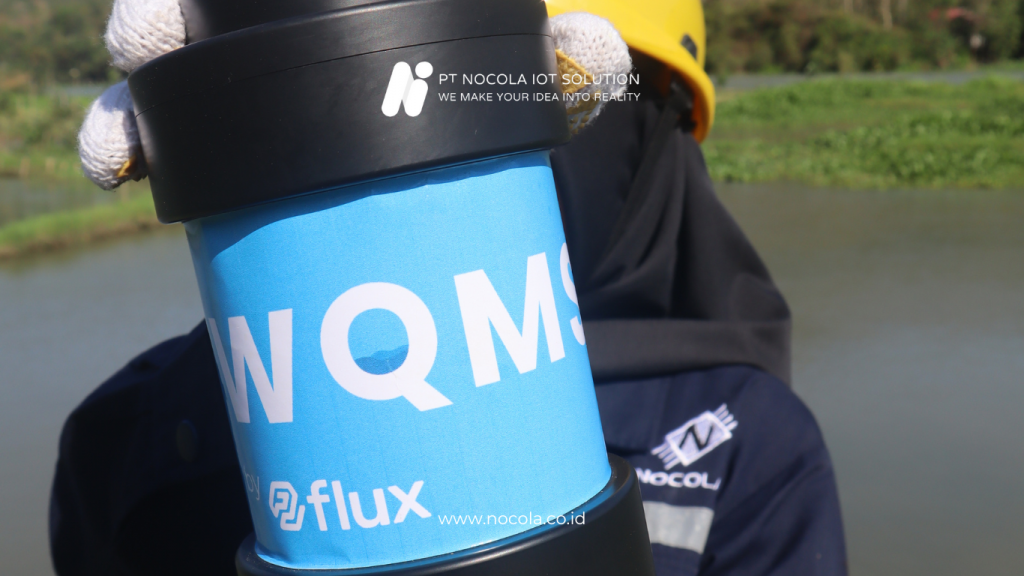
WQMS is a sensor-based water quality monitoring system that operates 24/7. This system is installed in rivers, lakes, clean water installations, and industrial wastewater disposal sites.
2.2 Parameters Monitored
Some common parameters in WQMS include:
pH
Dissolved Oxygen (DO)
Chemical Oxygen Demand (COD) / Biological Oxygen Demand (BOD)
Total Dissolved Solids (TDS)
Water temperature
Turbidity
With this data, the government can determine whether water is safe for consumption, agriculture, or ecosystem life.
2.3 Benefits of WQMS
Faster detection of water pollution
Monitoring industrial activities to ensure compliance with quality standards
Protecting aquatic ecosystems
Maintaining the quality of raw water for drinking water companies
2.4 Case Use Examples
Textile factories are required to monitor liquid waste.
Regional Drinking Water Companies (PDAM) monitor raw water quality.
Local governments monitor the conditions of strategic rivers.
3. AQMS: Real-Time Air Quality Monitoring
3.1 What is AQMS?
AQMS is a system that measures ambient air quality in open environments. It is widely installed in large cities, industrial areas, and for monitoring smoke from forest fires.
3.2 Parameters Monitored
AQMS can monitor:
PM2.5 & PM10
CO (Carbon Monoxide)
NOx (Nitrogen Oxides)
SO₂ (Sulfur Dioxide)
O₃ (Ozone)
HC (Hydrocarbon)
3.3 Benefits of AQMS
Provides daily AQI information
Detects pollution before it reaches dangerous levels
Identifies sources of pollution
Supports environmental research and public policy
4. CEMS: Modern Industry Emission Control
4.1 What is CEMS?
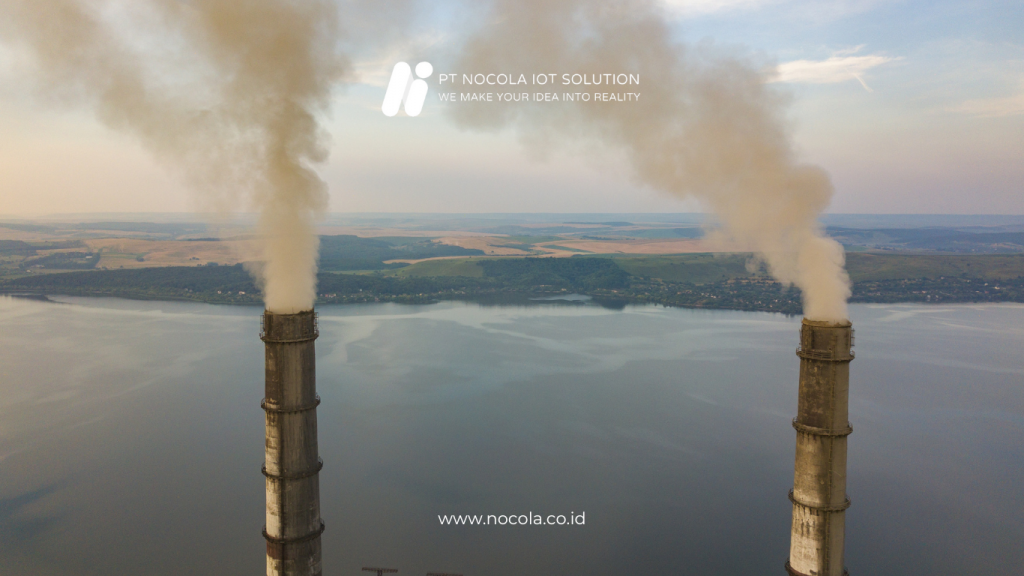
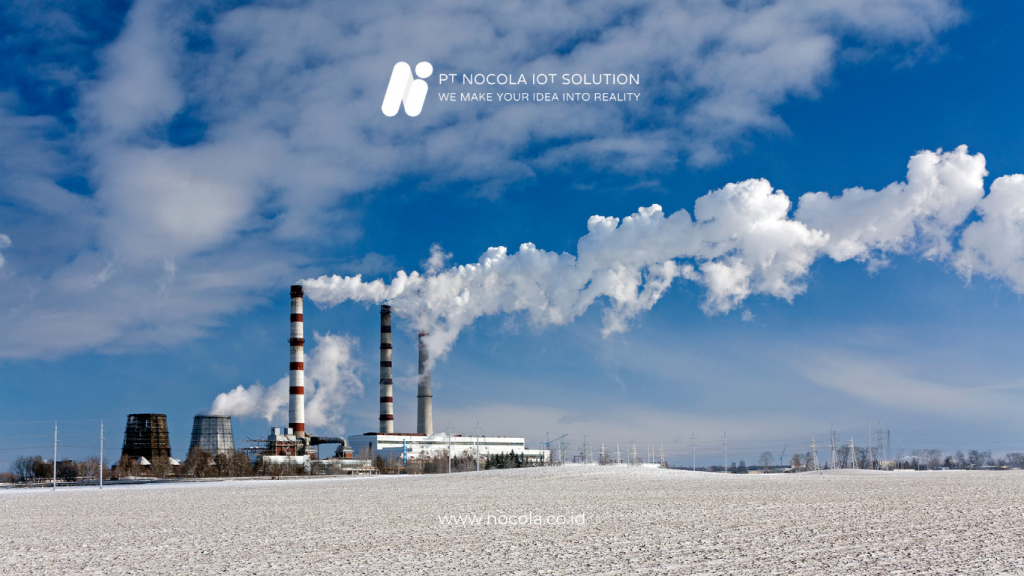
CEMS is a system used to monitor gas emissions from industrial smokestacks.
4.2 CEMS Parameters
CEMS measures:
SO₂ (Sulfur Dioxide)
NOx (Nitrogen Oxides)
CO (Carbon Monoxide)
CO₂ (Carbon Dioxide)
O₂ (Oxygen)
Opacity
Flow rate
CEMS is a regulatory requirement for many industries, especially those that produce significant emissions, such as coal-fired power plants (PLTU), cement factories, chemical plants, and smelters.
4.3 Benefits of CEMS
Helps industries comply with government quality standards
Prevents data manipulation in emissions reporting
Increases industry transparency
Provides automated reporting without manual input
5. The Smart Ecosystem: When WQMS, AQMS, and CEMS Work Together
5.1 Interconnected on One Dashboard
Imagine a dashboard displaying:
Water quality of rivers
Air quality of a city
Gas emissions from industries
With this integration, the government can see environmental conditions comprehensively.
5.2 Significant Impact on Government
Faster law enforcement
Real-time industry monitoring
Historical data for policy evaluation
Predictions of potential environmental disasters
5.3 Significant Impact on Industries
Easier environmental audits
Increased operational efficiency
Simplified regulatory compliance
Improved corporate reputation
5.4 Significant Impact on Communities
With AQMS, communities can:
Maintain outdoor activities
Know when the air is hazardous
Anticipate respiratory diseases
6. The Technology Behind the Smart Ecosystem
6.1 IoT (Internet of Things)
All sensors in WQMS, AQMS, and CEMS use IoT to:
Automatically send data
Reduce human error
Conduct 24/7 monitoring
6.2 AI (Artificial Intelligence)
AI is used for:
Predictive analysis
Anomaly detection
Pollution pattern identification
Action recommendations
6.3 Cloud Computing
The cloud plays a role in:
Storing large data sets
Providing dashboard access from anywhere
Enabling cross-system integration
Ensuring technological scalability
6.4 Big Data Analytics
With combined data from WQMS, AQMS, and CEMS:
The government can create periodic environmental maps
Industries can increase efficiency
Researchers can study pollution trends
Conclusion: The Smart Ecosystem is the Future of Environmental Protection
WQMS, AQMS, and CEMS are not just monitoring tools—they are the foundation of an intelligent ecosystem that helps protect the Earth with data. With real-time monitoring of water, air, and emissions, governments and industries can make quick and accurate decisions to keep the environment clean and sustainable.
The integration of these three systems offers:
Transparency
Efficiency
Environmental safety
Early pollution detection
Better resource management
This is the future of environmental protection: data as the key weapon for safeguarding the Earth.